Download: STOCH-FAST.ELA
Category: Indicator > Oscillators
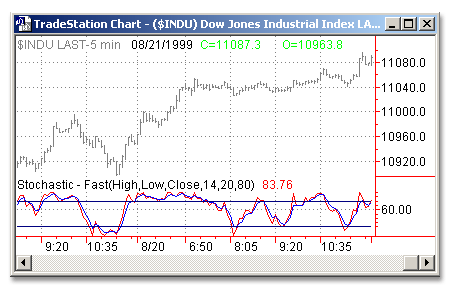
Description:
The Stochastic – Fast indicator calculates the location of a current price in relation to its range over a period of bars. The default settings are to use the most recent 14 bars (input Length), the high and low of that period to establish a range (input HighValue and LowValue) and the close as the current price (input CloseValue). This calculation is then indexed and plotted as FastK. A smoothed average of FastK, known as FastD, is also plotted. FastK and FastD plot as oscillators with values from 0 to 100.
Usage:
The direction of the Stochastics should confirm price movement. For example, rising Stochastics confirm rising prices.
Stochastics can also help identify turning points when there are non-confirmations or divergences. For example, a new high in price without a new high in Stochastics may indicate a false breakout. Stochastics are also used to identify overbought and oversold conditions when the Stochastics reach extreme highs or lows. Additionally, FastK crossing above the smoother FastD can be a buy signal and vice versa.
Inputs:
HighValue - Price used as the upper end of range to calculate FastK
LowValue - Price used as the lower end of range to calculate FastK
CloseValue - Value used as current price to calculate FastK
Length - Number of bars used to calculate FastK
OverSold - FastK level considered oversold
OverBought - FastK level considered overbought
EasyLanguage Code:
INPUTS: HIGHVALUE(HIGH), LOWVALUE(LOW), CLOSEVALUE(CLOSE), LENGTH(14), OVERSOLD(20), OVERBOUGHT(80);


PLOT1(FASTKCUSTOM(HIGHVALUE, LOWVALUE, CLOSEVALUE, LENGTH), "FASTK");

PLOT2(FASTDCUSTOM(HIGHVALUE, LOWVALUE, CLOSEVALUE, LENGTH), "FASTD");

PLOT3(OVERBOUGHT, "OVERBOUGHT");

PLOT4(OVERSOLD, "OVERSOLD");


{ALERT CRITERIA}

IF PLOT1 > OVERBOUGHT THEN

	ALERT("THE %K LINE IS IN OVERBOUGHT TERRITORY")

ELSE

	IF PLOT1 < OVERSOLD THEN

		ALERT("THE %K LINE IS IN OVERSOLD TERRITORY");